XLGantt is a program designed to enable project scheduling in Microsoft Excel. It is composed of the following features. You don’t need to install this program because it is an Excel macro file. You just download this file, save it to a folder, and open it in Excel.
Contents
1. Download the latest version
Download the program file from the link below!
After downloading, unzip and use the "XLGantt_v4.7.0_20210530_Release_ENG.xlsm" file.
Note: It is recommended that you do not download a xlgantt file on sites other than xlworks homepage because the file may be changed or may contain a virus.
2. Security Settings
After downloading the XLGantt file, when the "PROTECTED VIEW" appears as below, click the "Enable Editing" button.
![]()
If you see the "SECURITY WARNING" related to using macros, click the “Enable Content” button.
![]()
3. Enter tasks
You can modify the task entered as an example, or delete all the example tasks and enter new tasks.
- The Orange columns in the title (total work, planned work, etc.) are automatically calculated.
- The blue column (task, start date, finish date, %Work Complete, etc.) must be entered manually by the user.
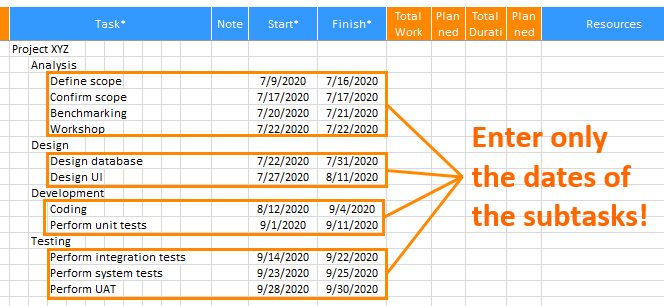
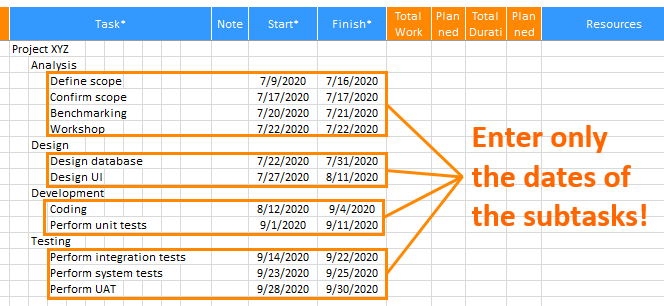
For the start and finish dates, just enter the dates of the sub tasks and press “Update Schedule” on the ribbon to automatically enter the summary task's date.
If you enter only the dates of the subtasks and click "Update Schedule" on the ribbon, the dates of the summary tasks are entered automatically.
1) Enter the date
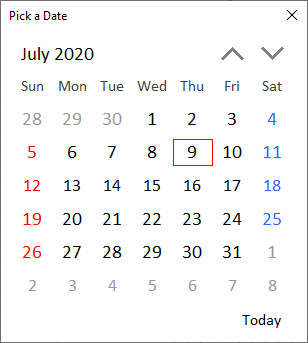
You can enter the start and finish dates for a task, or choose from a calendar.
Right-click on the cell where you want to enter the date and pick a date.
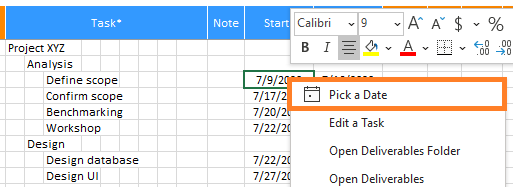
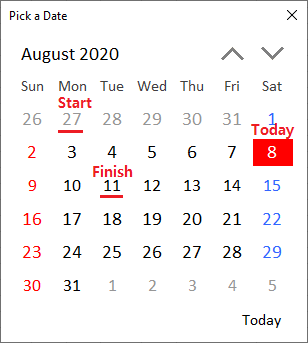
Click "Pick a Date" and the calendar will appear. If you double-click the date you want to enter, the date is entered in the cell.
2) Indent or outdent Task
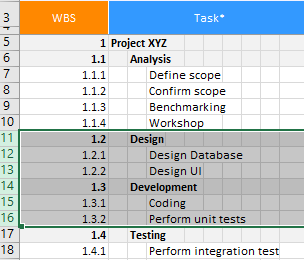
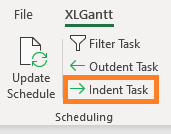
To indent or outdent a task, select the task (multiple tasks can be selected) and click “Indent Task”, “Outdent Task” on the ribbon.
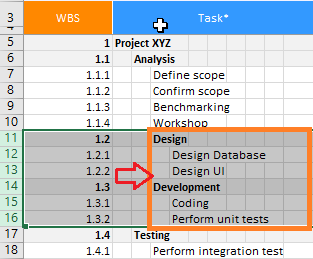
Let's indent "Design" and "Development" tasks as follows.
① Select tasks to indent
② Indent Task (Ribbon menu > XLGantt)
③ All tasks from row 11 to row 16 have been indented.
3) Mark tasks as milestones
Milestones are significant events such as the completion of a phase of work or system open. Because the milestone itself doesn’t normally include any work, milestones are represented as tasks with zero workload.
In Excel Gantt, milestones are marked as follows.
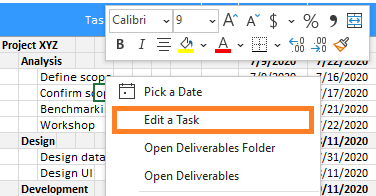
① Select the task to be marked as a milestone with a mouse and click the right mouse button to display a menu. Click "Edit a Task" from the menu.
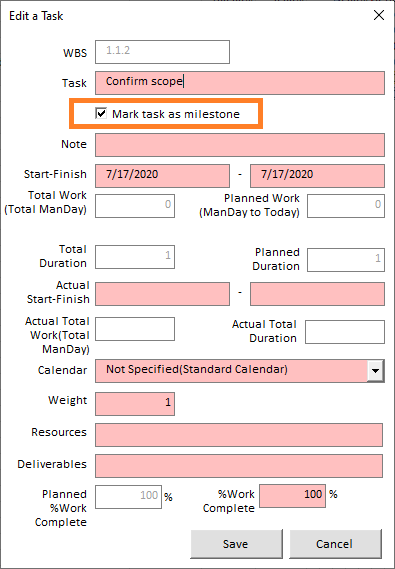
② On the "Edit a Task" pop-up window, check "Mark task as a milestone" and click the Save button.
③ The total workload and planned workload of the "Confirm Scope" task are calculated as 0(zero). On the Gantt chart, the milestone appears as a diamond.

4. Update Schedule
Enter tasks and go to Ribbon > XLGantt tab, click the "Update Schedule".
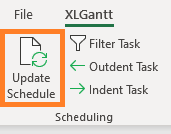
As shown in the illustration below, the workloads of the subtasks, the workloads of the summary tasks, and the dates of summary tasks are automatically calculated.
Group rows are displayed on the left side of the task, and the Gantt charts are automatically displayed on the right side.

Let's look at the above features one by one.
1) Group rows
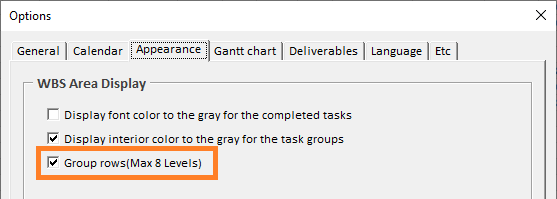
Go to the ribbon menu> XLGantt tab > Options > Appearance tab.
If "Group rows(Max 8 Levels)" is checked, row groups are always displayed.
2) The date of the summary task
Is automatically calculated using the dates of the subtasks.
• Start date of summary task: The earliest date among the start dates of the subtasks.
• Finish date of the summary task: the latest date among the finish dates of the subtasks.
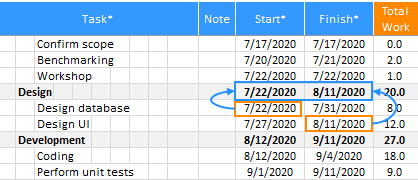
In the example below, the start date and finish date of the "Design" task are automatically calculated using the start date of the "Design Database" task and the finish date of the "Design UI" task.
3) Total work
The workload of the summary task is automatically calculated using the workloads of the subtasks.
Workload of the summary task: The sum of the workloads of the subtasks.
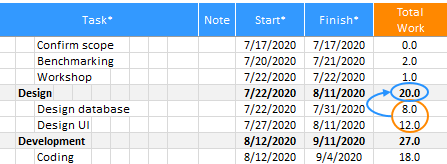
In the example below, the workload of the "Design" task is automatically calculated as the sum of the subtasks (8 + 12 = 20 days).
– Design Database(8 days)
– Design UI (12 days)
4) Planned work(Planned workload)
The "planned work" displayed to the right of the "total work" is the workload to be done by the current date and is automatically calculated. The calculation method that adds up to the parent workload is the same as the calculation method of "total work".

The total workload from 7/27/2020 to 8/11/2020 for the “Design UI" task above is 12 days, but the total workload from 7/27/2020 to today(as of 8/8/2020) is 10 days.
※ Workload calculation
Until now, the total workload and the planned workload were calculated by the number of working days excluding non-working days, it is assumed that one person is fully assigned to a single task.
If several people are assigned to a single task or only some resources of one person (eg 50%) are assigned, how should the workload be calculated?
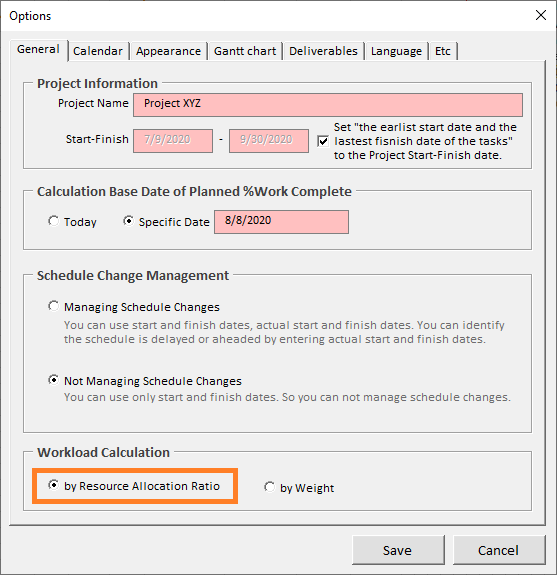
* It is assumed that the workload calculation method is selected as “by Resource Allocation ratio” (Ribbon Menu> XLGantt > Options > General)
Example 1 - Two people are assigned to the "Design UI" task
If nothing is entered in the resource column, the total workload and planned workload are calculated as the number of working days excluding non-working days,

but if you enter the name of the person in charge in the resource column, the total workload and planned workload are calculated using the following formula.
Total workload = Number of working days excluding non-working days * Number of people entered (John, Elsa)
24 days = 12 days * 2 people

Example 2 - Only some resources of one person (eg 50%) are assigned to the "Design UI" task.
Total workload = number of working days excluding non-working days * Number of entered people (John[50%])
6 days = 12 days * 50% (0.5 John)

Total workload = number of working days excluding non-working days * Number of entered people (John[50%], Elsa)
18 days = (12 days * 50% (0.5 John)) + (12 days * 1 Elsa)

5)Total Duration, Planned Duration
The workload described above calculates the amount of work. If two people are assigned to a task, the workload is doubled, and the workload of the summary task is calculated by adding up the workload of the subtasks.
However, the total duration and the planned duration are not the amount of work but the duration. This is the value you need when you are wondering about the duration between the start date and the finish date rather than the amount of work.
- In the example below, two people were assigned to the “Design UI” task, so the total workload is 24 days, but the total duration is simply a duration, so we can see that it is calculated as 12 days.
- The planned duration is the duration that must be performed until today (as of August 8, 2020). Since the start date of the “Design UI” task is July 27th, the “planned duration” that must be performed until today (as of 2020-08-08) is calculated as 10 days excluding holidays.

6) Planned %Work Complete, %Work Complete
Planned %Work Complete is the planned progress that must be performed until today. It is the planned workload divided by the total workload (= planned workload/total workload).
- The Planned %Work Complete of the “Design UI” task below is calculated as 83.33% (= 20 days / 24 days).
- %Work Complete can only be known by the person who has performed the task, so check the work progress and enter it directly.

Although I explained above, let's take a look at the meaning of “Planned %Work Complete” and ” %Work Complete” for better understanding.
- Suppose you need to perform a task that takes 10 days from January 1st to January 10th, as shown in the example below. If today is January 7th, you have to complete 70% of the task on a planned basis.
- In other words, 70%(Planned %Work Complete) is the completion rate to be performed by today.
So today is January 7th, but if you only perform 6 days' worth of tasks, the "%Work Complete" for this task is 60%, with a 10% delay.

5. Update Schedule after modifying tasks
Once you enter a task, it can be rescheduled or changed. If there is any change in the entered contents, modify it directly.
1) Change project name, project start date, finish date
Go to the ribbon menu> XLGantt tab > Options> General> "Project Information", change the project name to display the changed project name in the upper left of the Schedule sheet.

The Start-Finish date can be set in two ways.
- Set "the earliest start date and the latest finish date of the tasks" to the Project Start-Finish date.
- Enter Start-Finish date directly as the date you want (uncheck above checkbox)
2) Enter "%Work Complete"
The Planned %Work Complete of the task is automatically calculated based on the current date, but since the %Work Complete is only known to the person who has performed the task, the %Work Complete of the task is checked and entered directly.
As shown in the image below, you can enter 80% of the %Work Complete for the “Design UI” task.

Since all necessary items have been entered, if you click "Update Schedule" on the ribbon menu, you can see that the %Work Complete of subtasks (Design Database, Design UI) is added up to the upper level "Design" task and the %Work Complete is automatically calculated to 86.15%.
According to the entered %Work Complete, the progress bar (blue bar) is drawn on the Gantt chart.
[ XLGantt(Excel Gantt) How to ]
- Excel WBS and Gantt Chart - XLGantt How to #1 - Getting Started With XLGantt
- Excel WBS and Gantt Chart - XLGantt How to #2 - Enter tasks, Update schedule
- Excel WBS and Gantt Chart - XLGantt How to #3 - Setting Gantt chart display styles
- Excel WBS and Gantt Chart - XLGantt How to #4 – Keeping track the progress of the project
- Excel WBS and Gantt Chart - XLGantt How to #5 – Analysis Report
- Excel WBS and Gantt Chart - XLGantt How to #6 – Managing Schedule Change
- Excel WBS and Gantt Chart - XLGantt How to #7 – Deliverables
- Excel WBS and Gantt Chart - XLGantt How to #8 - Adding Tasks to Microsoft Outlook Calendar
- Excel WBS and Gantt Chart - XLGantt How to #9 - Multilingual Support
- Excel WBS and Gantt Chart - XLGantt How to #10 – Importing Schedules from Another File
- Excel WBS and Gantt Chart - XLGantt How to #11 – Calendar
- Excel WBS and Gantt Chart - XLGantt How to #12 – Integration with Excel Features
- Excel WBS and Gantt Chart - XLGantt How to #13 – Importing Server Data
- Excel WBS and Gantt Chart - XLGantt How to #14 – Workload calculation
- Excel WBS and Gantt Chart - XLGantt How to #15 – Setting WBS Area and Color Theme
